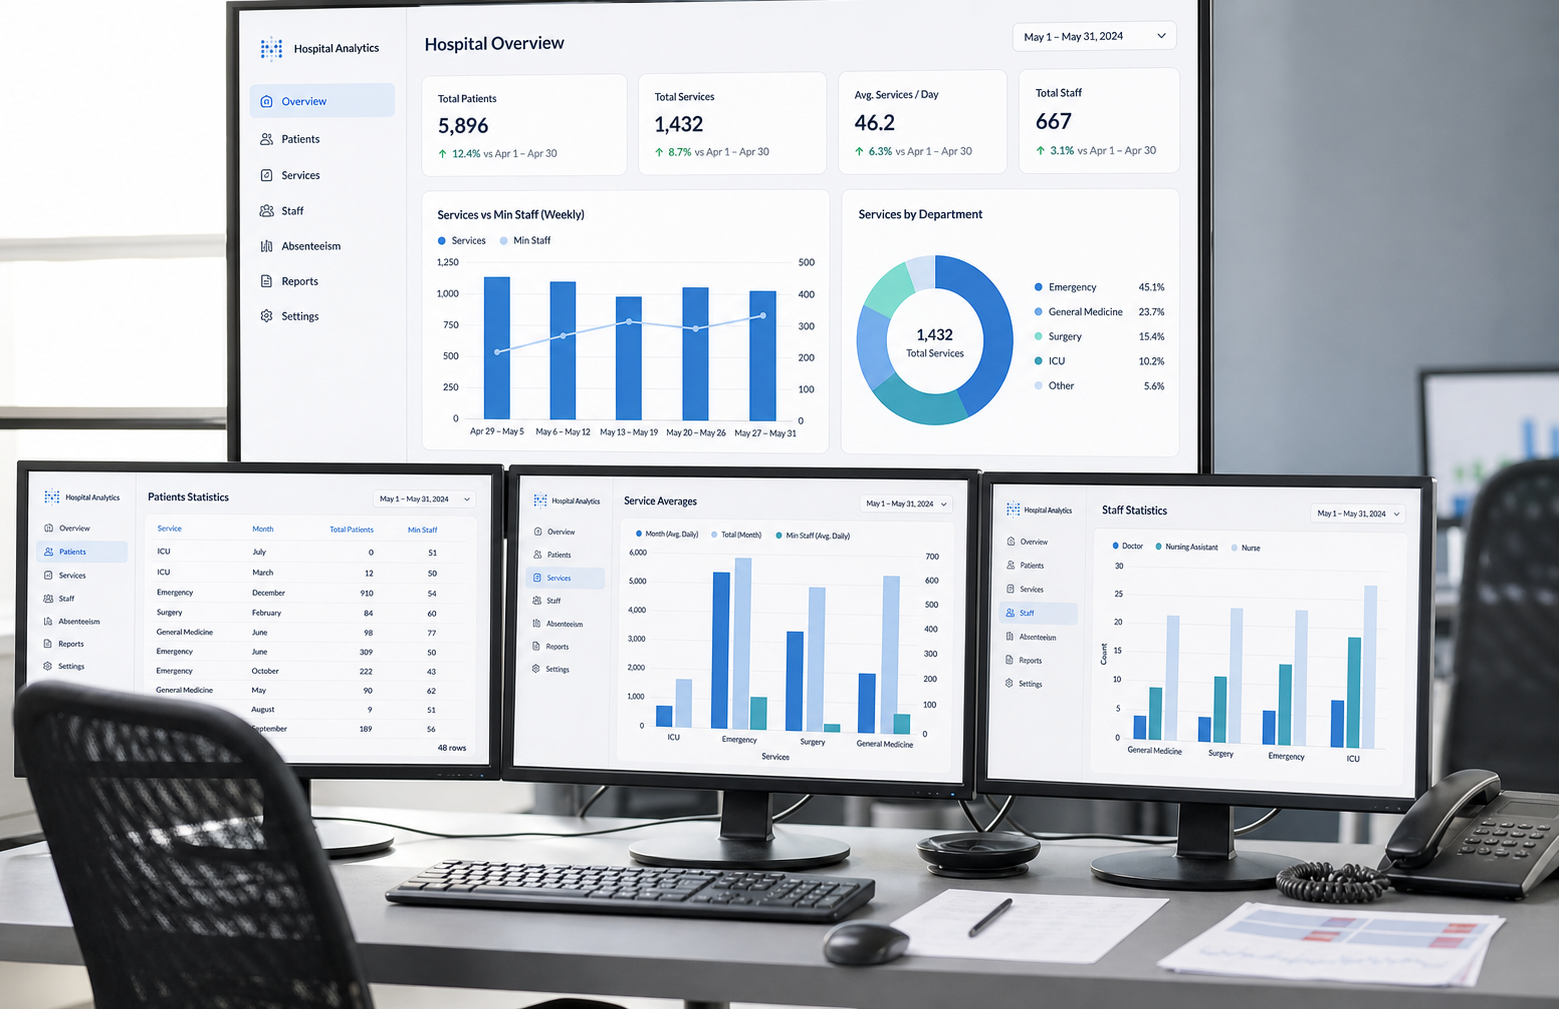
This is the final step of our dbt project: displaying our data in a dashboard so that managers and directors can use it to make informed decisions. This dashboard contains four reports, and we will show how to create each one in Metabase:
- Patient statistics
- Staff statistics
- Absenteeism
- Services
First, we need to connect Metabase to the database used in our dbt project, which follows a medallion architecture. Metabase will read the data from the Gold layer, or Gold model, in dbt. Therefore, we will explain how to configure the PostgreSQL database used by dbt in Metabase.
How to config postgresql database with Metabase?
First we go to Metabase homepage of our docker image http://localhost:3000 then go to “Admin”

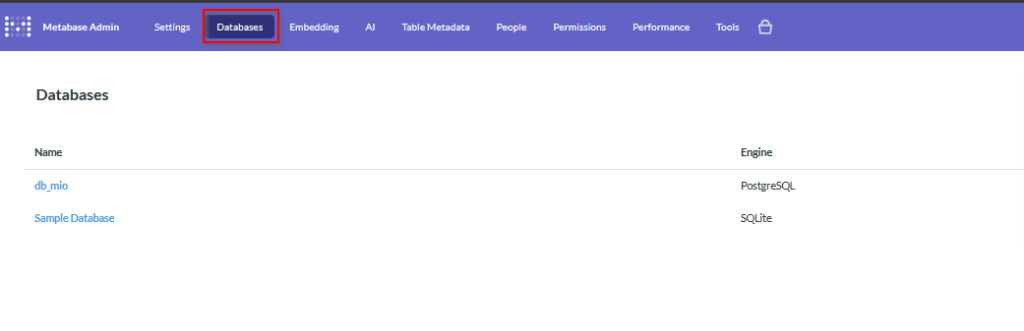
Then go to “Databases”
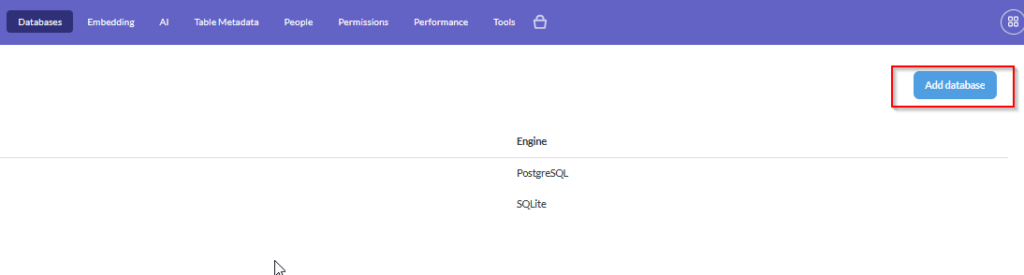
Click in “Add Database”
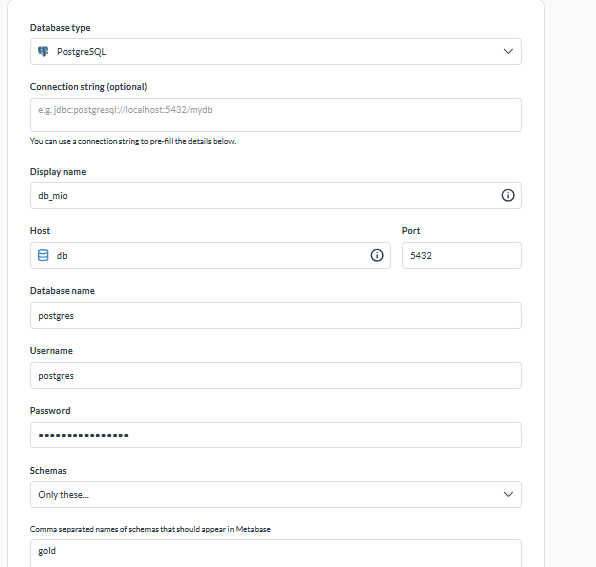
We enter the database connection details and select the only schema we will use: the Gold layer, or Gold model, in dbt. Finally, we click the Save button
Now we can create reports in our dashboard. We need to explain how to create a dashboard and a report within it.
How to create a Dashboard in Metabase?
We go to Metabase of our docker image, in http://localhost:3000, click in new button and select dashboard.

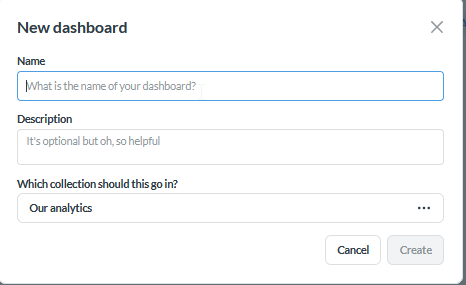
We enter the dashboard’s name and description, and select where to save it.
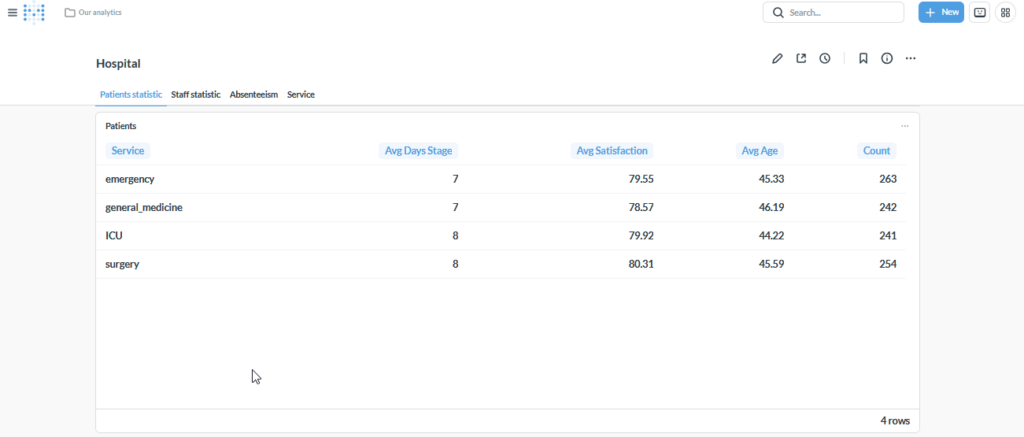
Patients statistic
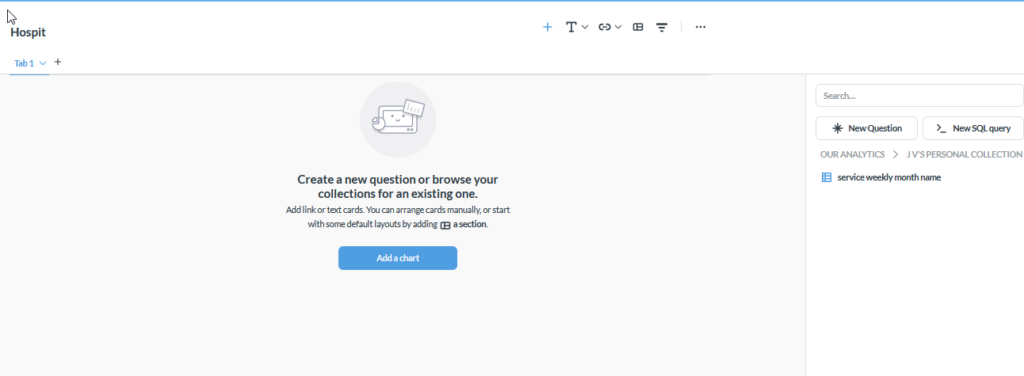
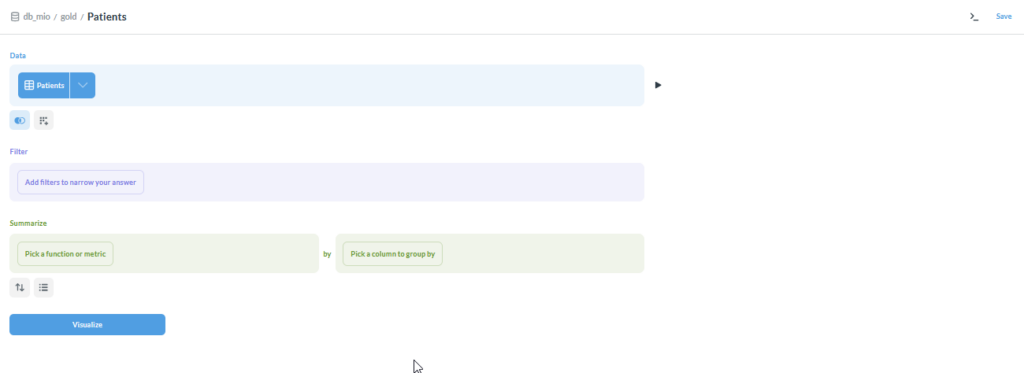
To create this report we go to our dashboard and click in “Add a chart” then click in “New Question”
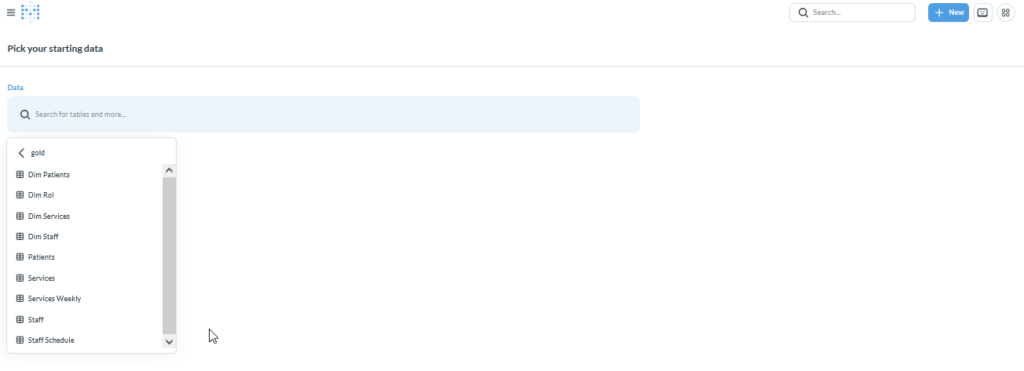
After that we have to select our database that we config, and the gold schema then select the table Patients
Then select Visualize
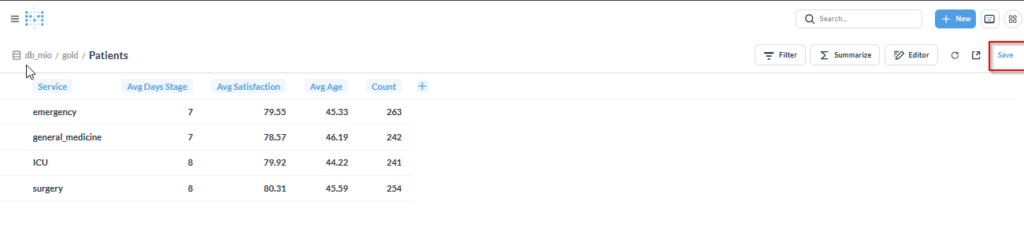
Save the name of the question after see the results
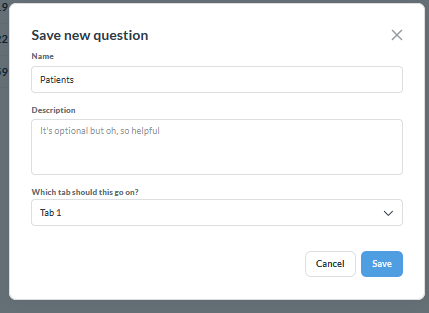
Fill the form with the name of the report
That’s all. We process the data beforehand, so we don’t need to make any changes in Metabase.
Staff statistic
We repeat firsts steps of Patients statistic but we select the staff`s table of gold layer.
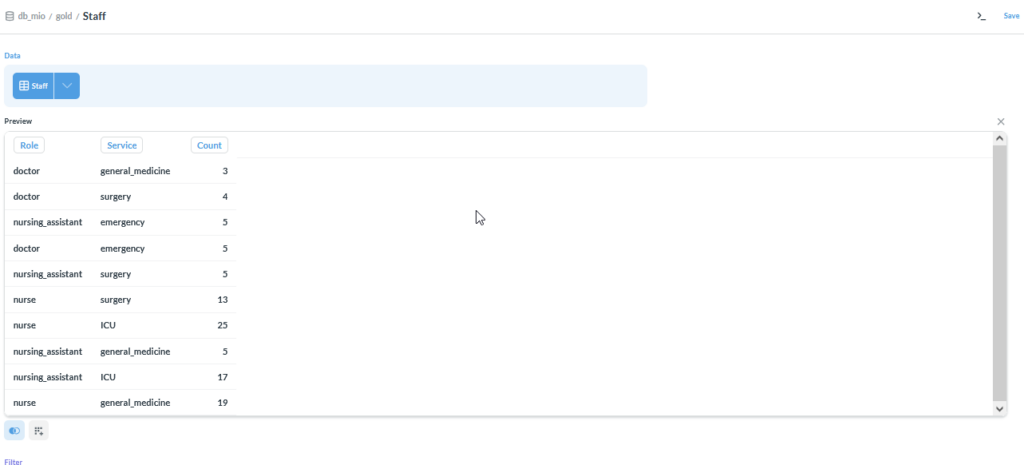
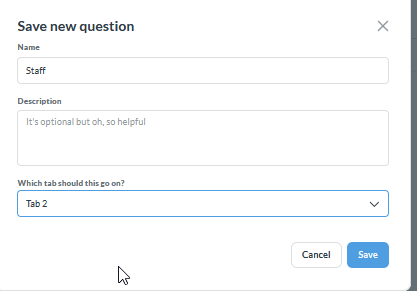
Click Save, enter the required information, and select the tab where we want to display it.
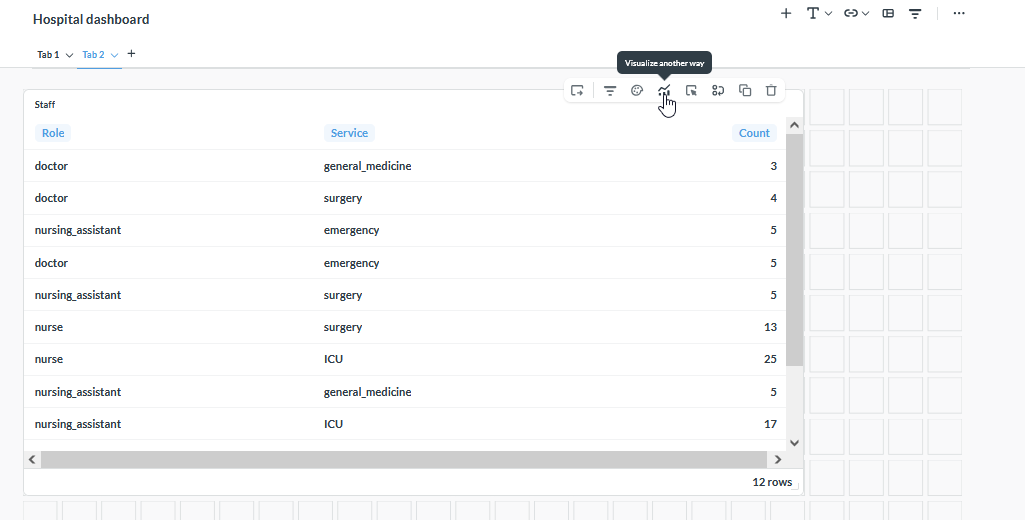
Click in Visualize in another way
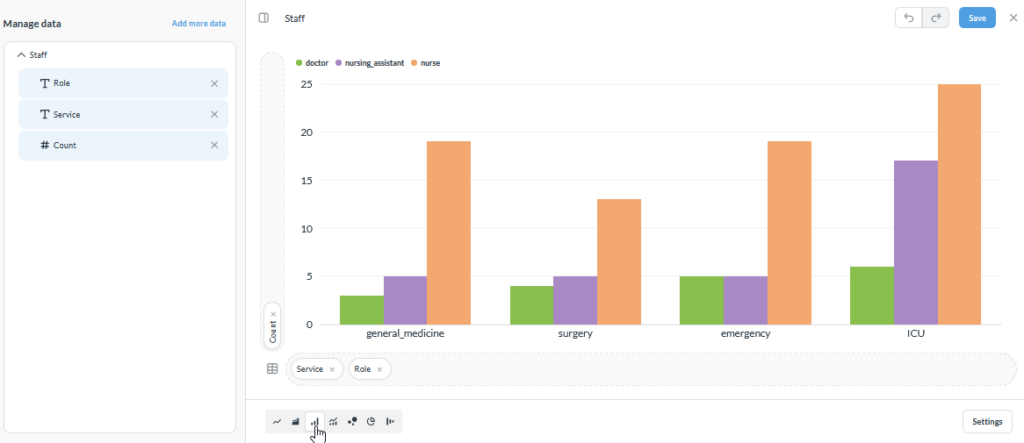
We display six types of visualizations. We select all the fields and place Service first, followed by Roles, on the X-axis. We use Quantity for the Y-axis.
Click in Save button
Absenteeism
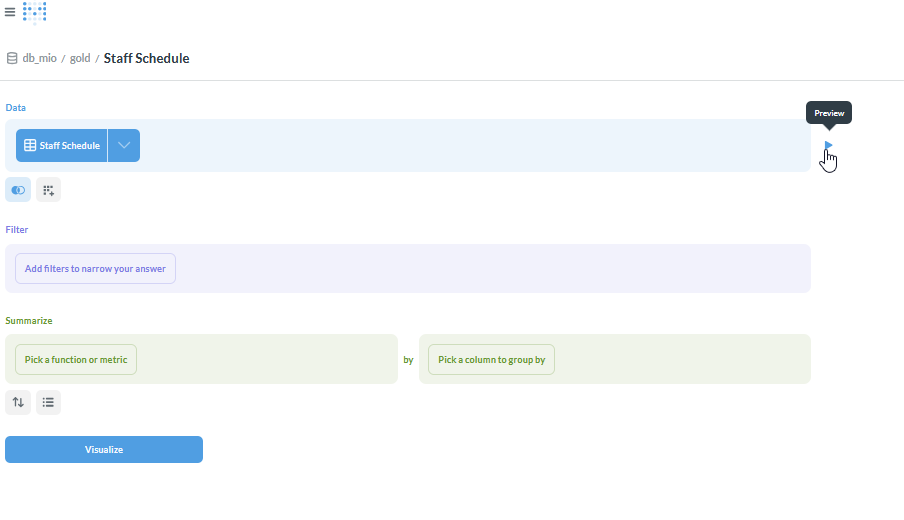
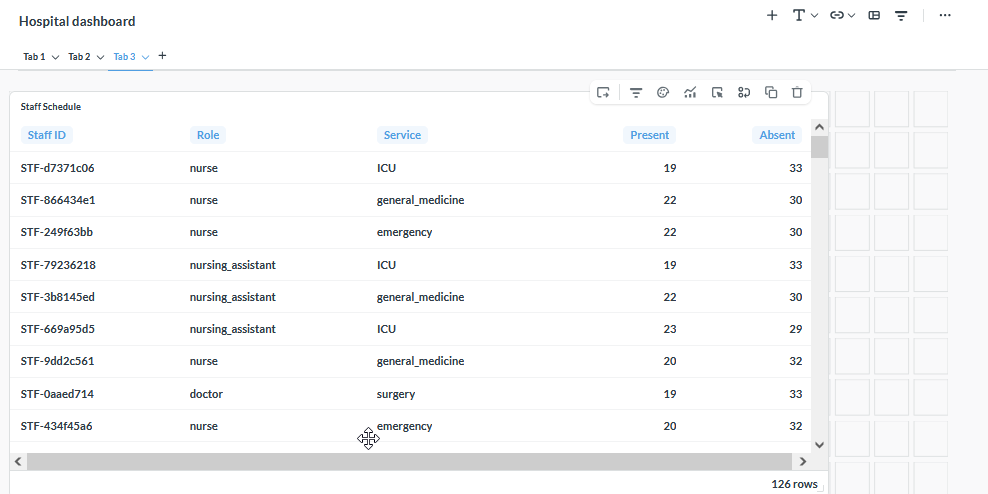
This report lists the days on which each hospital employee does not work. It is similar to the first report, which presents the data in a table. We follow the same steps as for the first report, but when selecting the data, we choose Staff Schedule from the Gold layer.
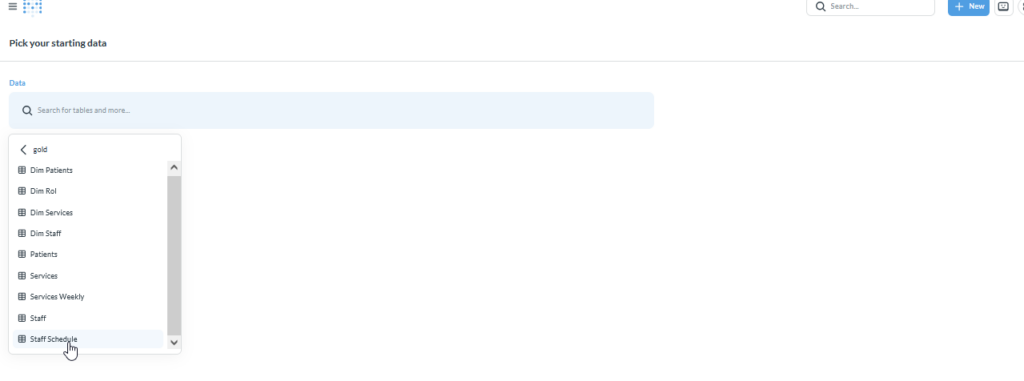
Click in “Preview”
Then click in save
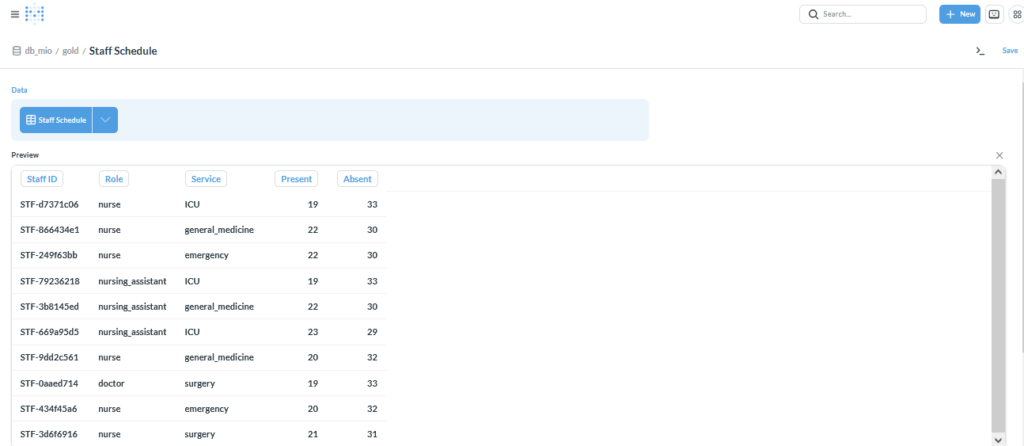
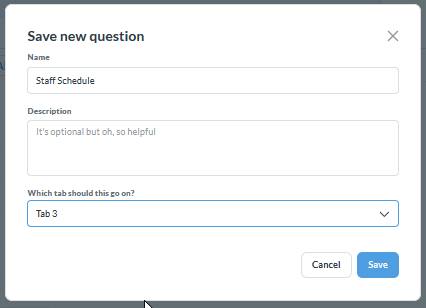
Then, enter the report’s details and select the tab where you want to place it.
Finally we see the report in tab 3
Service
This report is different because we will execute a SQL query directly in Metabase. We will use the analyses folder in dbt to store and version-control all the queries used in our reports and dashboards
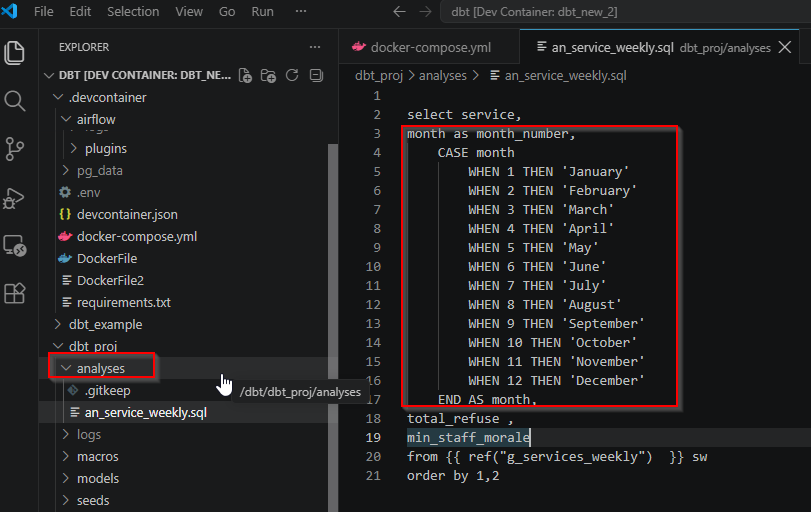
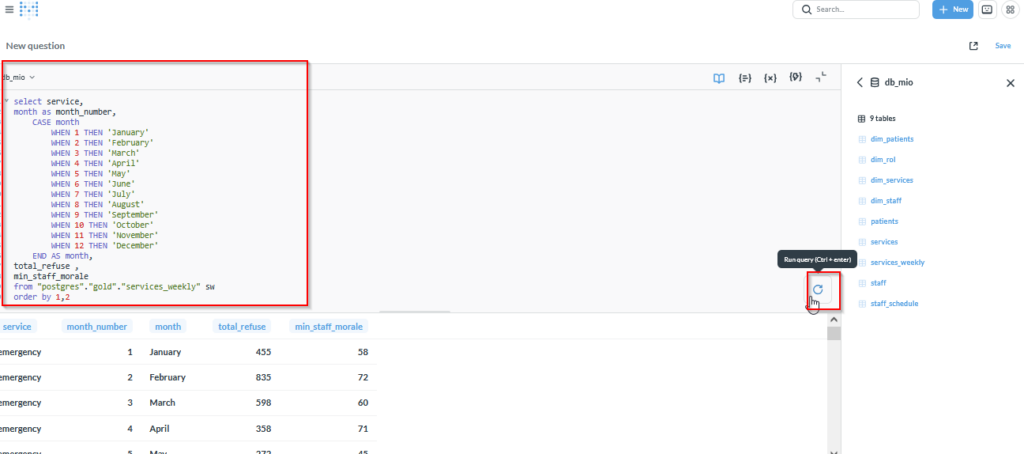
In the table Service_weekly of gold layer we only have the number of the month in this query we make a case to add the month name.
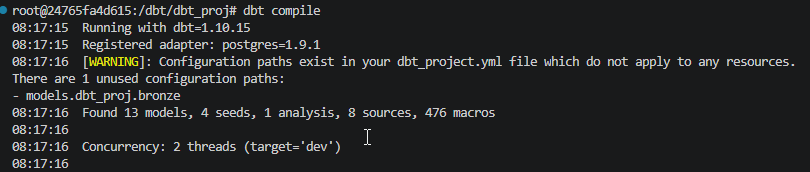
so we execute dbt compile
Then we go to the target folder and see the query
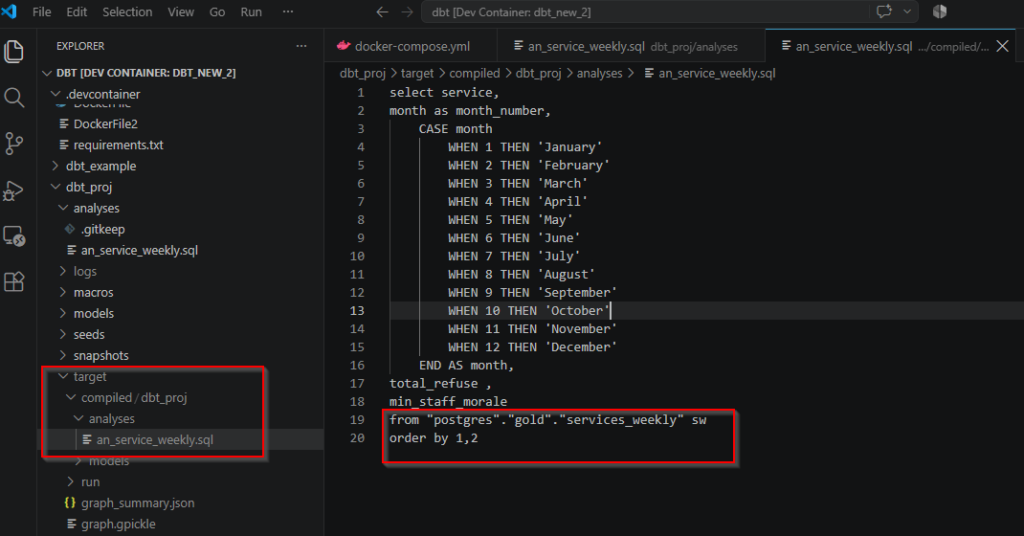
we see that dbt translate the schema name and we have a query to copy and paste in Metabase.
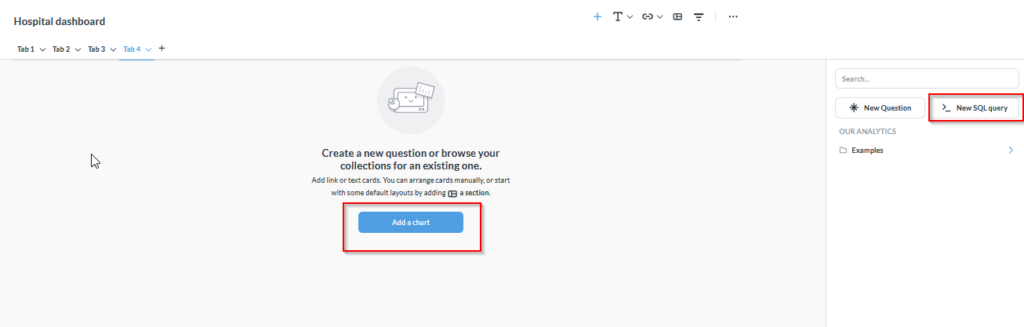
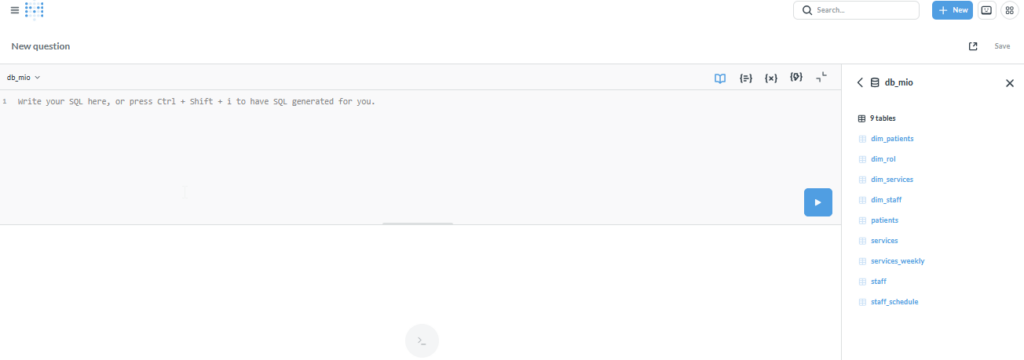
In the new tab, click Add a chart. In this case, select New SQL query.
We select the database and paste the SQL query. Then, we click Visualize to view the results. Once we have confirmed that everything is correct, we save the report by clicking the Save button.
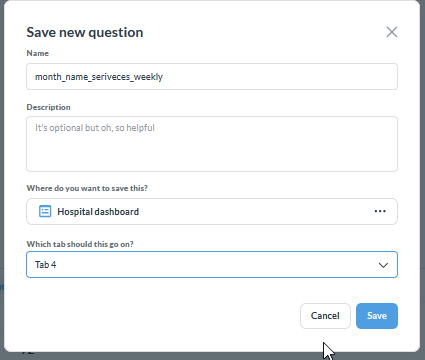
Fill the report name and the tab
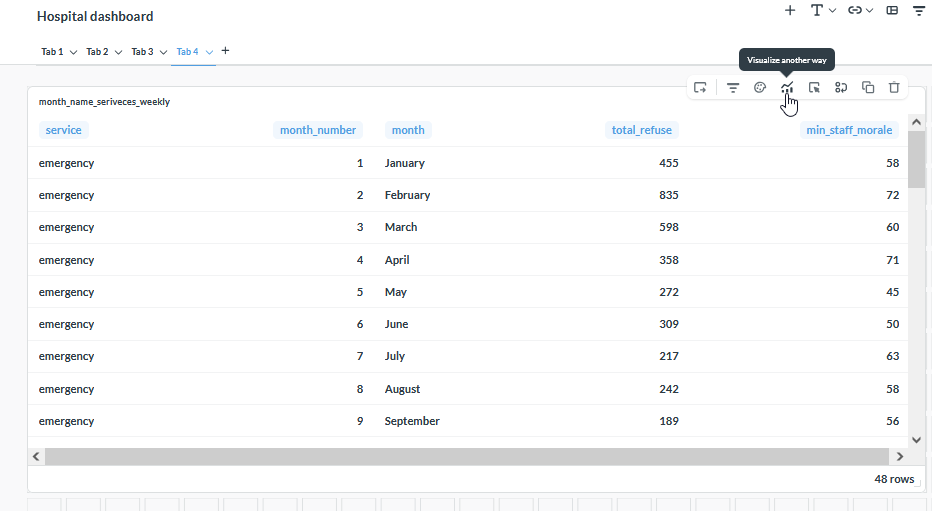
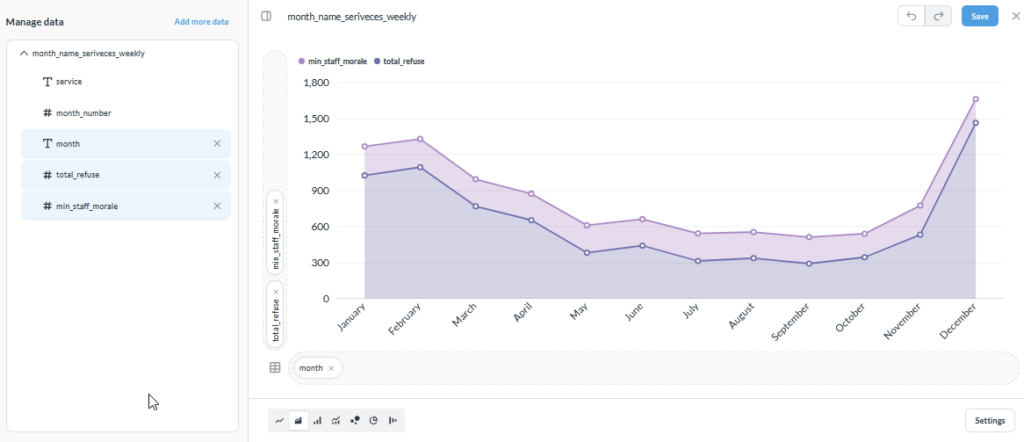
We can see the data, but we want to change the visualization format. To do this, click Visualize another way.
We select the line chart and choose Total Refusals and Minimum Staff Morale for the Y-axis. For the X-axis, we select Month Name. Finally, we click Save.
Summary
This project uses dbt to transform data following a medallion architecture. The data is processed and stored in the Gold layer, which is then connected to Metabase to create dashboards and reports for managers and directors.
The dashboard includes reports on patient statistics, staff statistics, absenteeism, and services. Some reports use the tables from the Gold layer, while others use SQL queries stored in dbt’s analyses folder for version control. In Metabase, we select the database, create or paste the required query, visualize the results, choose the appropriate chart type, and save each report in the corresponding dashboard tab.
Links:
Leave a Reply
You must be logged in to post a comment.